
MINDRON SPECTRUM · FTIR & SPECTRAL ANALYZER
Spectro Engine Standby
PERKINELMER .SP PROCESSING RESULT PREVIEW
Expected Analysis Output
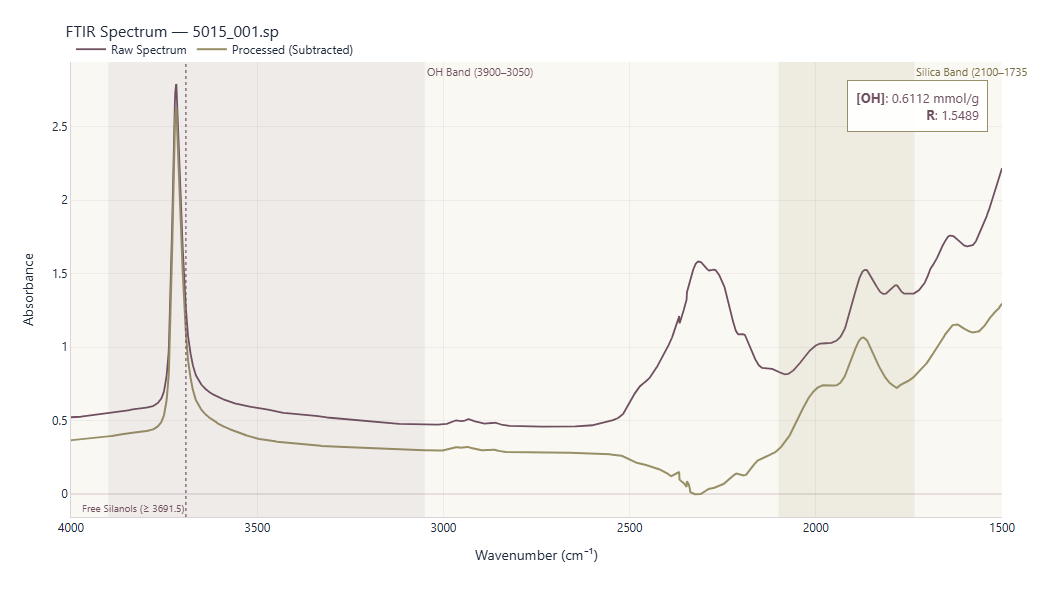
This is what your analysis looks like after uploading a PerkinElmer (.sp) spectrum file. The system automates background solvent subtraction, baseline correction, band integration, and silanol quantification in real time.
Sample File:5015_001.spPerkinElmer Binary
Processed & Integrated
Click to Inspect High-Resolution Details
Raw Spectrum
Processed (Subtracted)
Free Silanols (≥ 3691.5)
Integrated OH & Silica Bands
Calculated Silanol MetricsAUTO INTEGRATED
Silanol [OH]0.6112mmol / g
Ratio R1.5489Area(OH) / Area(Ref)
OH Band Window:3900 – 3050 cm⁻¹
Silica Reference:2100 – 1735 cm⁻¹
Isolated Peak:≥ 3691.5 cm⁻¹
How .sp Files are Processed
- 1Binary IngestionUpload PerkinElmer .sp file directly without manual conversion.
- 2Voltalef SubtractionCompensates for mulling oil absorption baseline across 4000–1500 cm⁻¹.
- 3Dual Band IntegrationSimpson numerical integration over silanol and internal silica bands.
- 4Quantitative QuantificationOutputs calibrated silanol density [OH] in mmol/g and adds record to CSV export.
Live FTIR Analysis Station
M
Connecting to the FTIR analyzer...
Checking the analysis service. This may take a few moments.
Connecting...